Tenable Security Center
See Everything. Predict What Matters. Managed On-Prem.
Get a risk-based view of your IT, security and compliance posture so you can quickly identify, investigate and prioritize your most critical assets and vulnerabilities.
Managed on-premises and powered by Nessus technology, the Tenable Security Center suite of products provides the industry’s most comprehensive vulnerability coverage with real-time continuous assessment of your network. It’s your complete end-to-end vulnerability management solution.
Request a Demo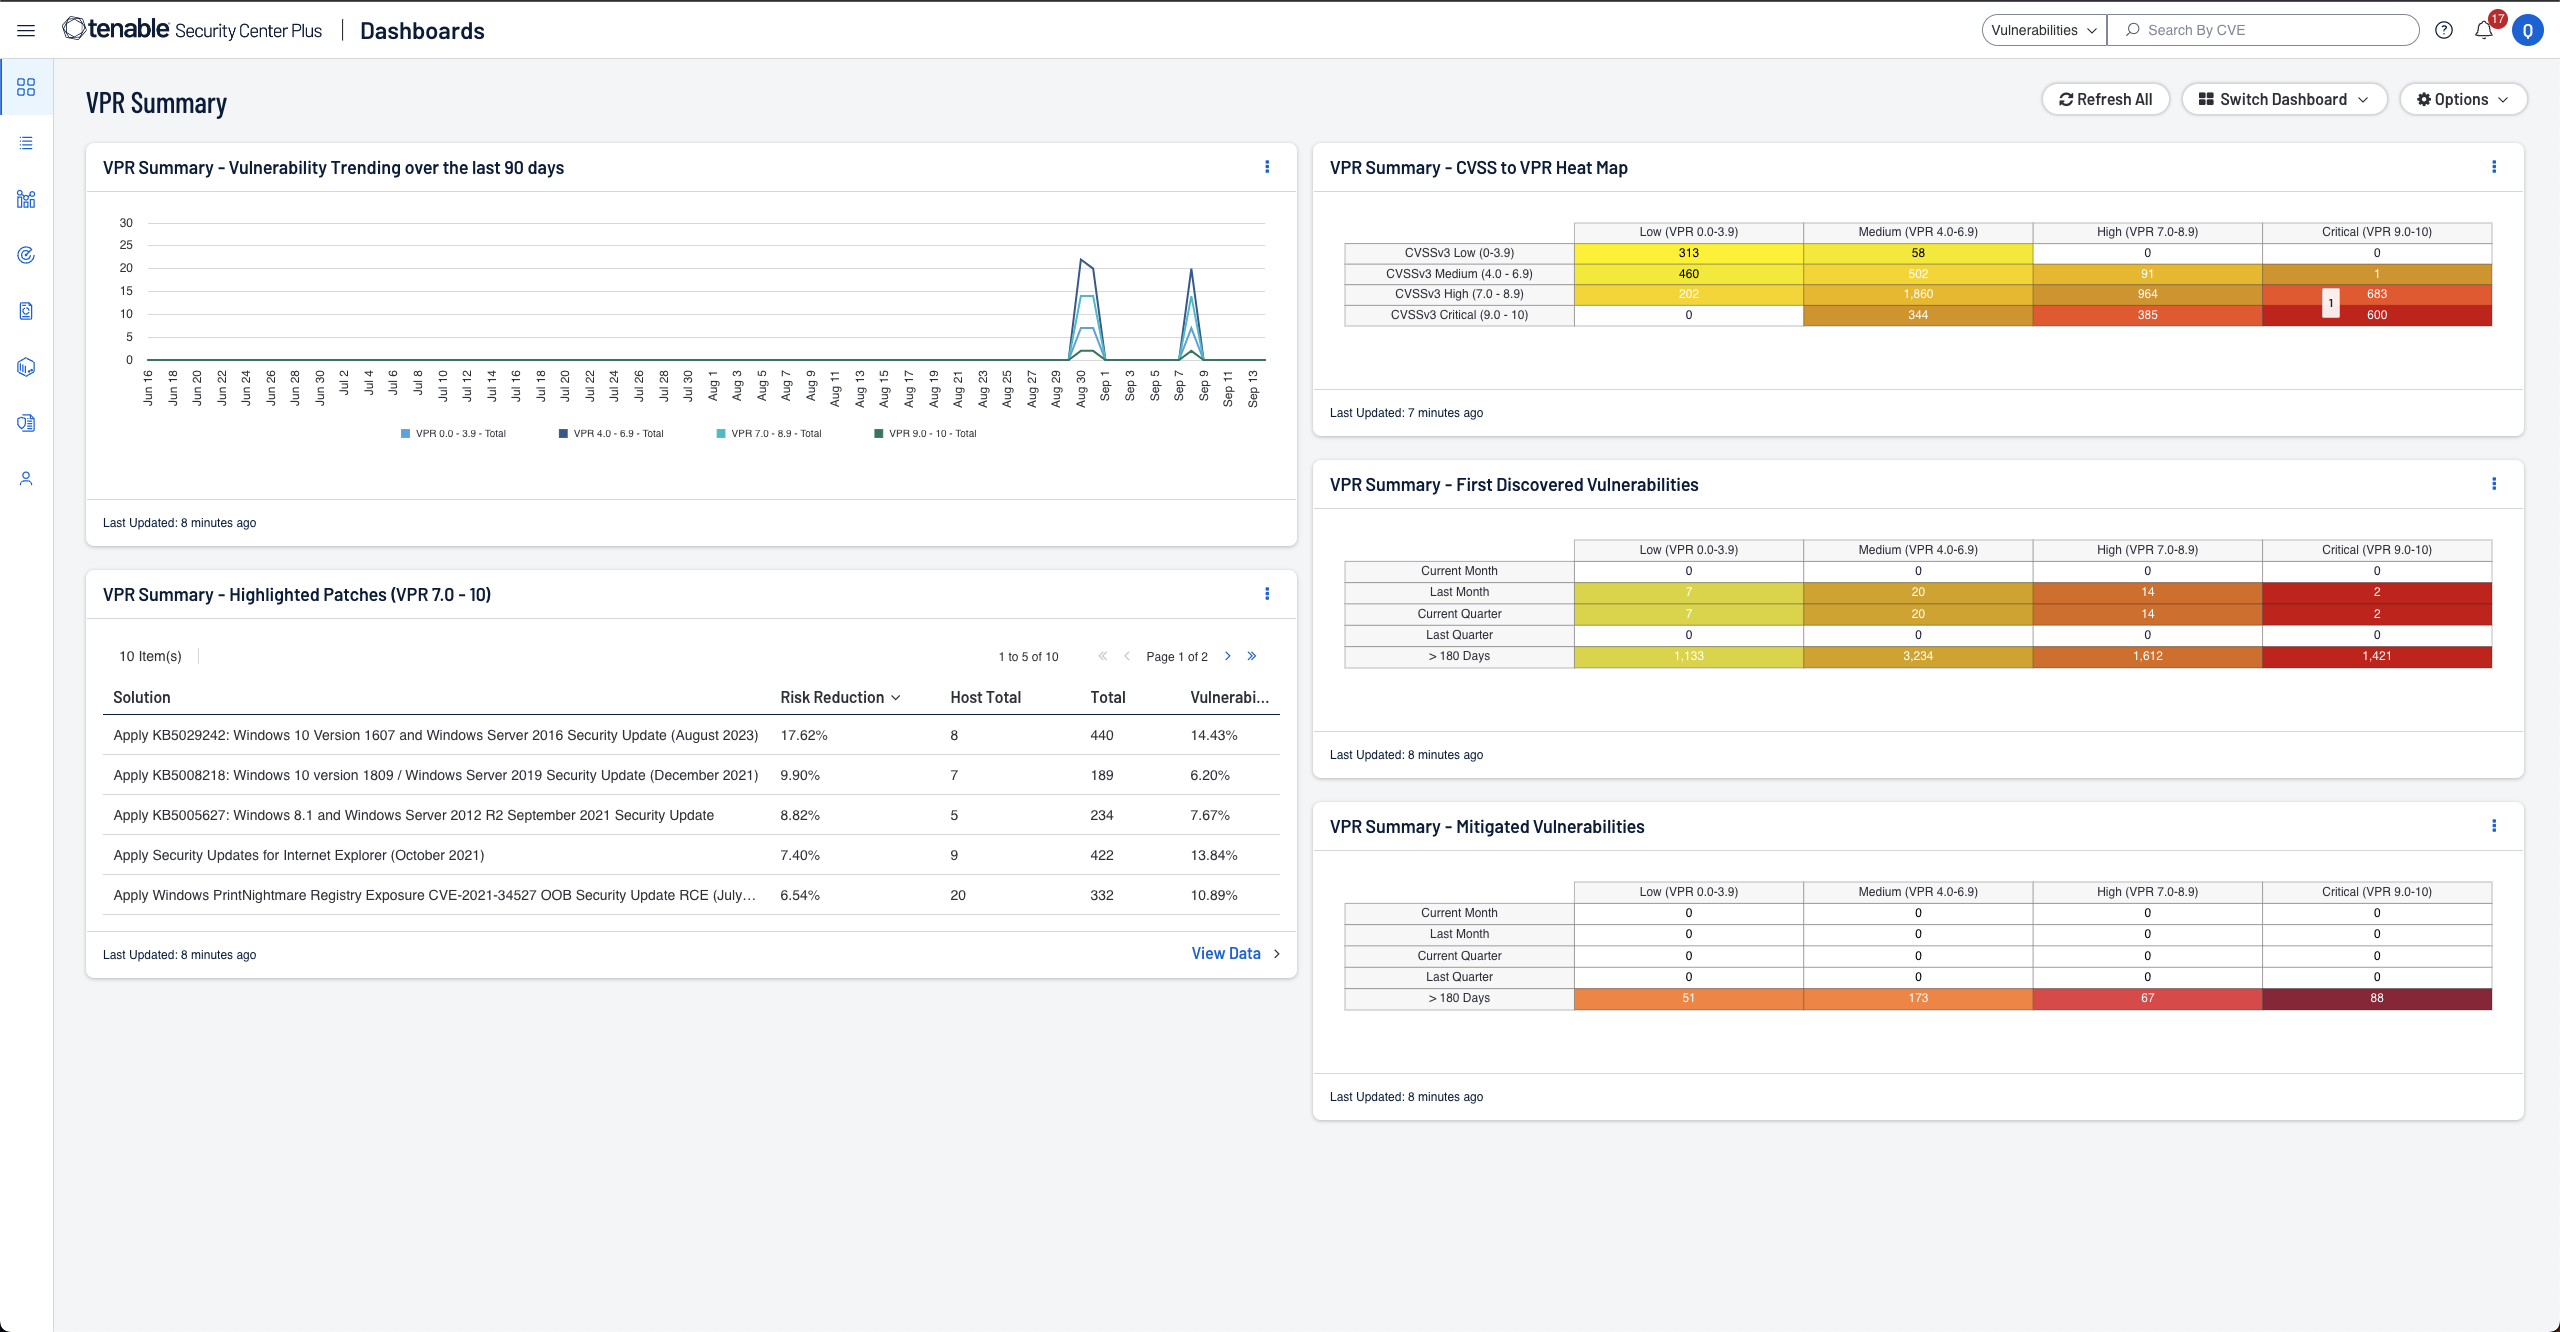

Discover
Active scanning, agents, passive monitoring, external attack surface management and CMDB integrations provide a complete and continuous view of all of your assets including ones that were previously unknown.

Assess
With coverage for more than 79,000+ vulnerabilities, Tenable has the industry’s most extensive CVE coverage and security configuration support to help you understand your security and compliance posture with confidence.

Prioritize
Tenable’s Predictive Prioritization technology combines vulnerability data, threat intelligence and data science to give you an easy-to-understand risk score so you know which vulnerabilities to fix first.
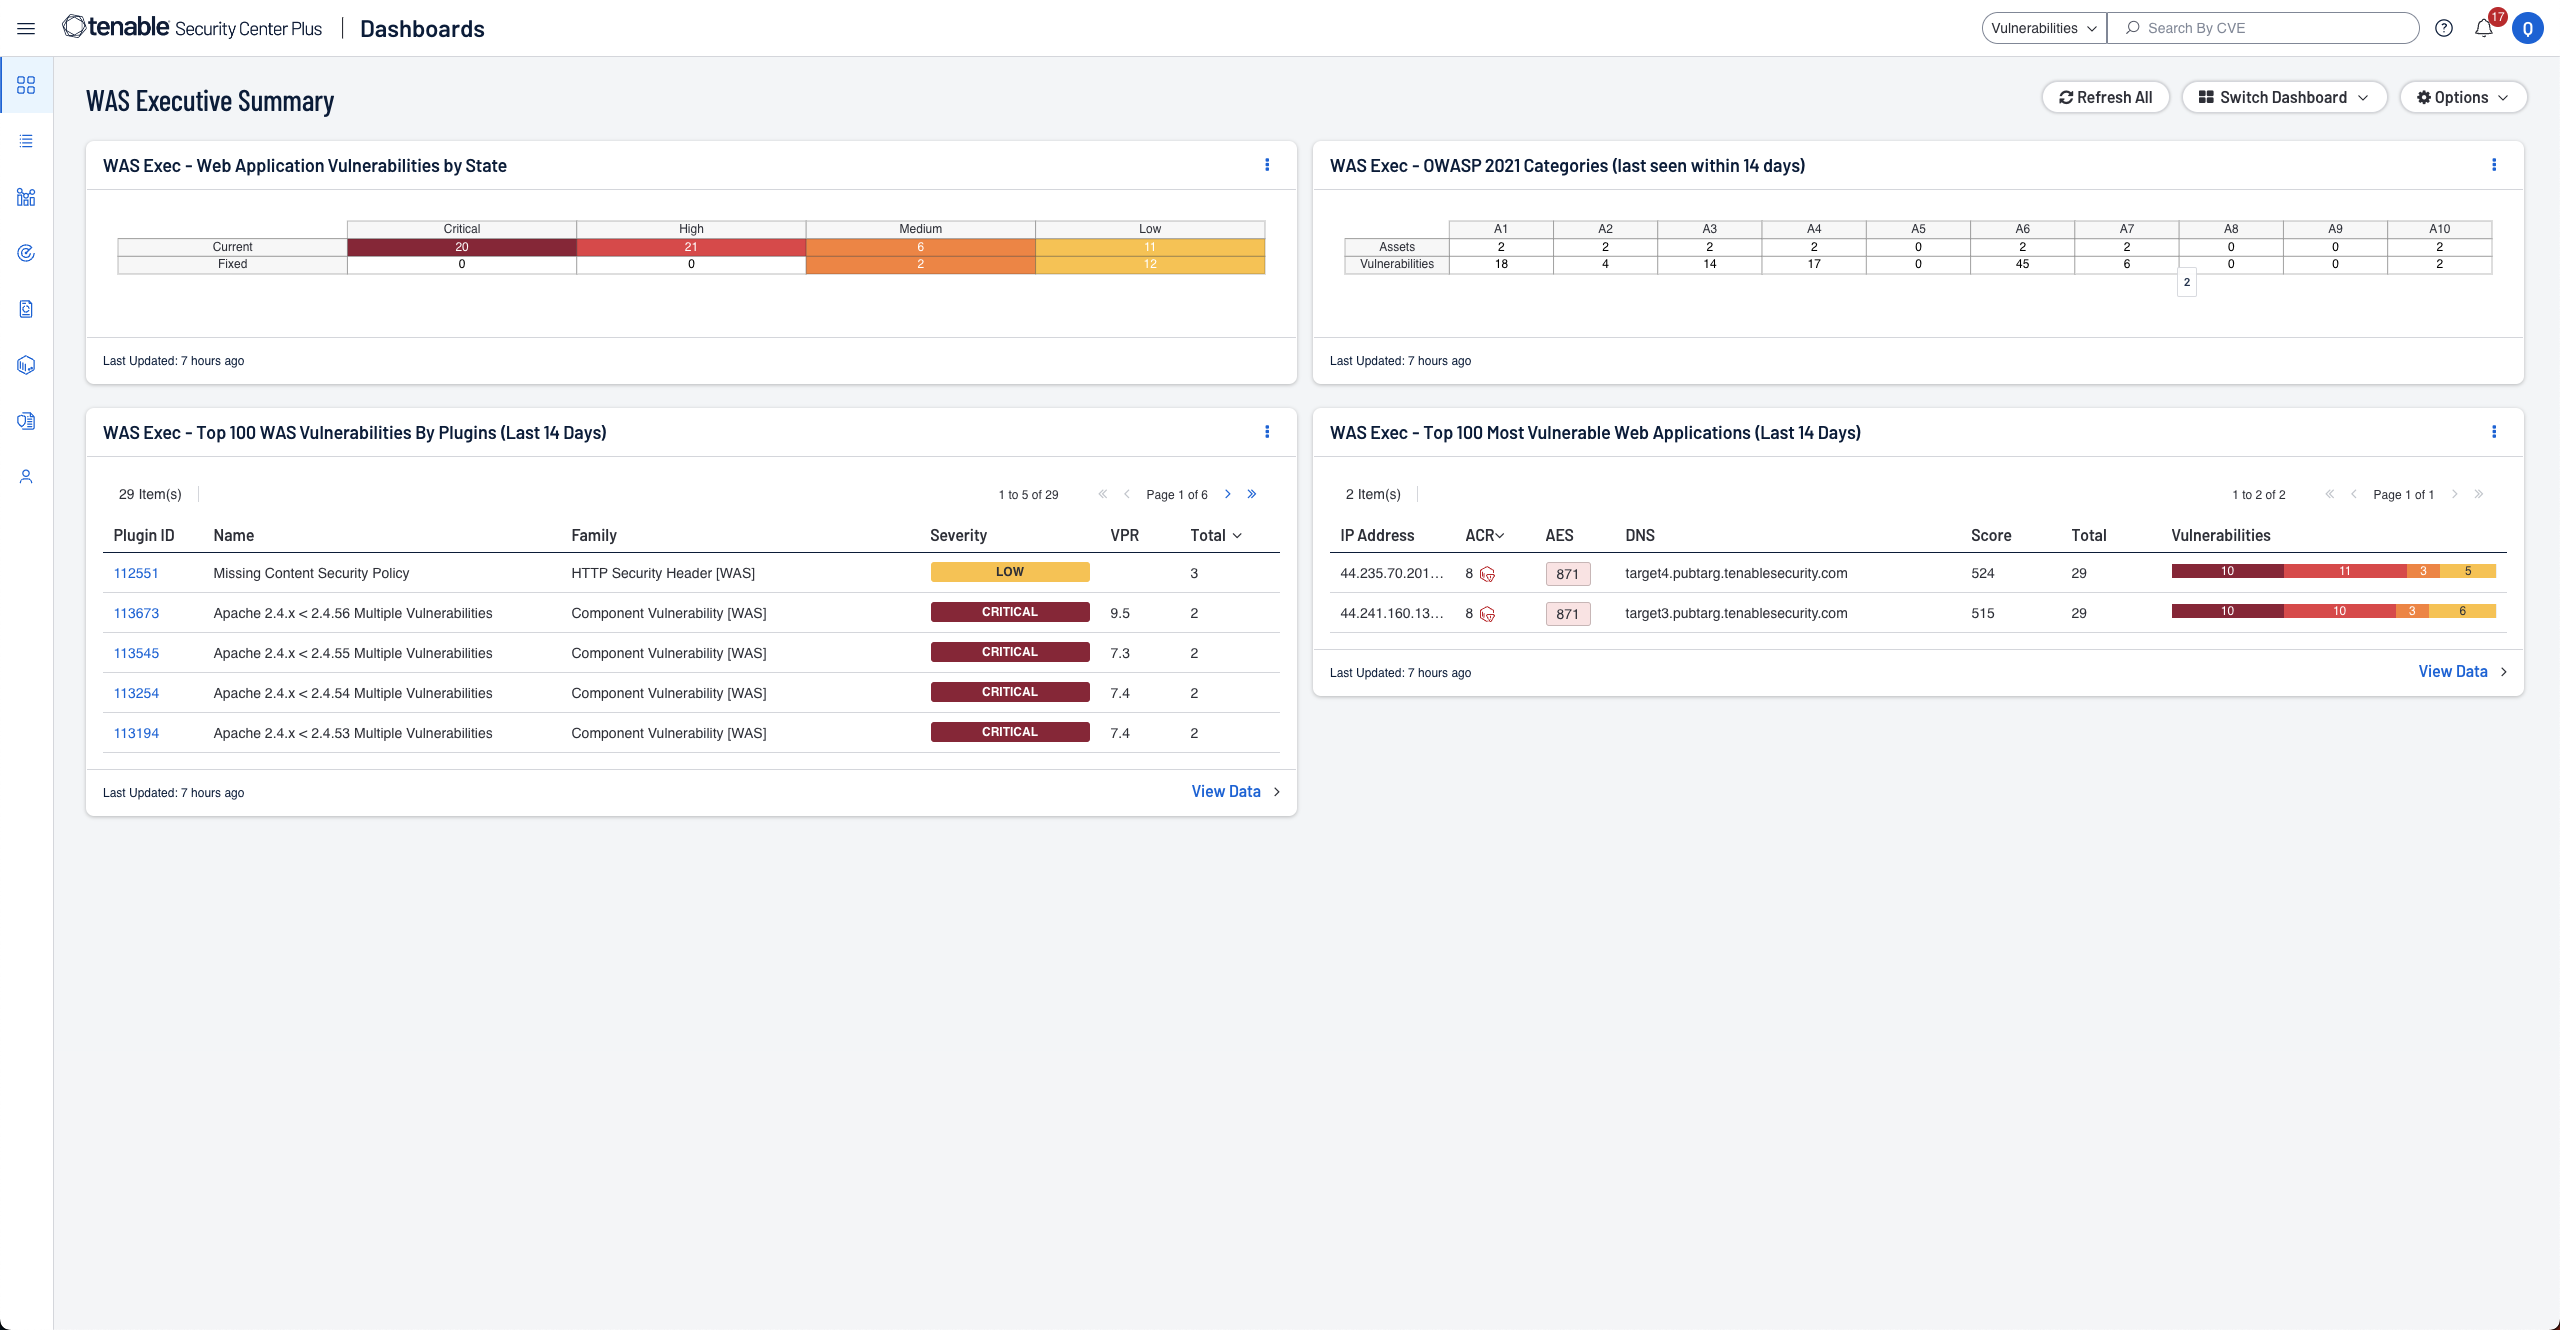
On-Prem Web App Scanning Available Through Tenable Security Center

Enhance your defenses by adding on-premises web application security with Tenable Web App Scanning. Seamlessly integrated into the Security Center UI, Tenable Web App Scanning empowers you to identify and address vulnerabilities across your network and web applications, bolstering your security posture while managing your data onsite.
Learn MoreAvailable Through Tenable One Exposure Management Platform
Tenable One is an exposure management platform designed to help your organization gain visibility across your modern attack surface, focus efforts to prevent likely attacks, and accurately communicate cyber risk to support optimal business performance. The Tenable One platform offers broad vulnerability coverage spanning IT assets, cloud resources, containers, web apps and identity systems.
Learn more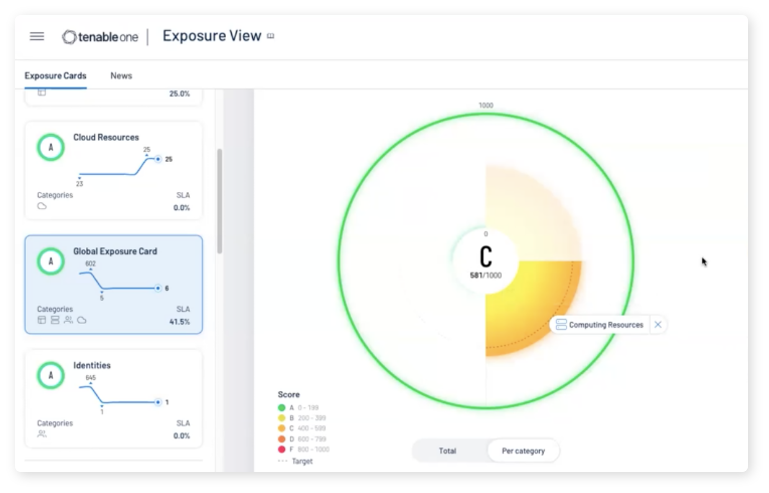
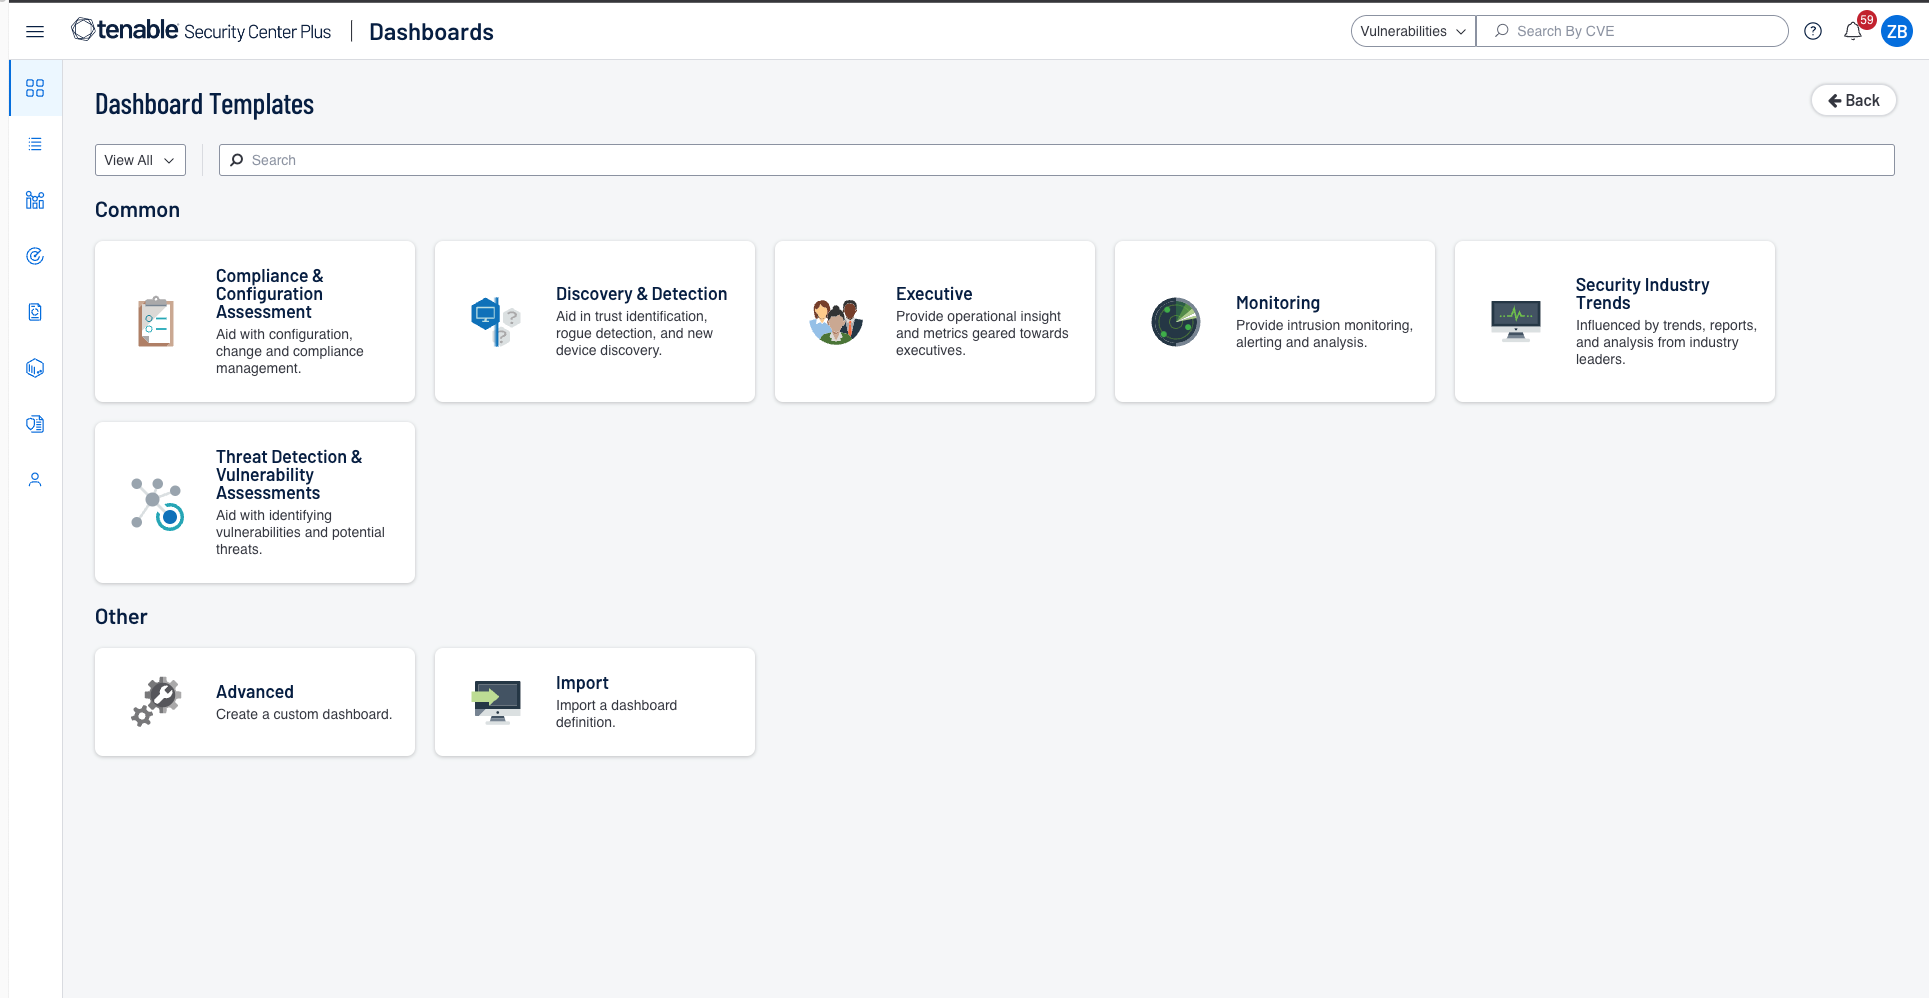
The Tenable Security Center Family
Tenable Security Center
- Risk-based vulnerability management, on-prem
- Immediate visibility into your network with unlimited Nessus scanners
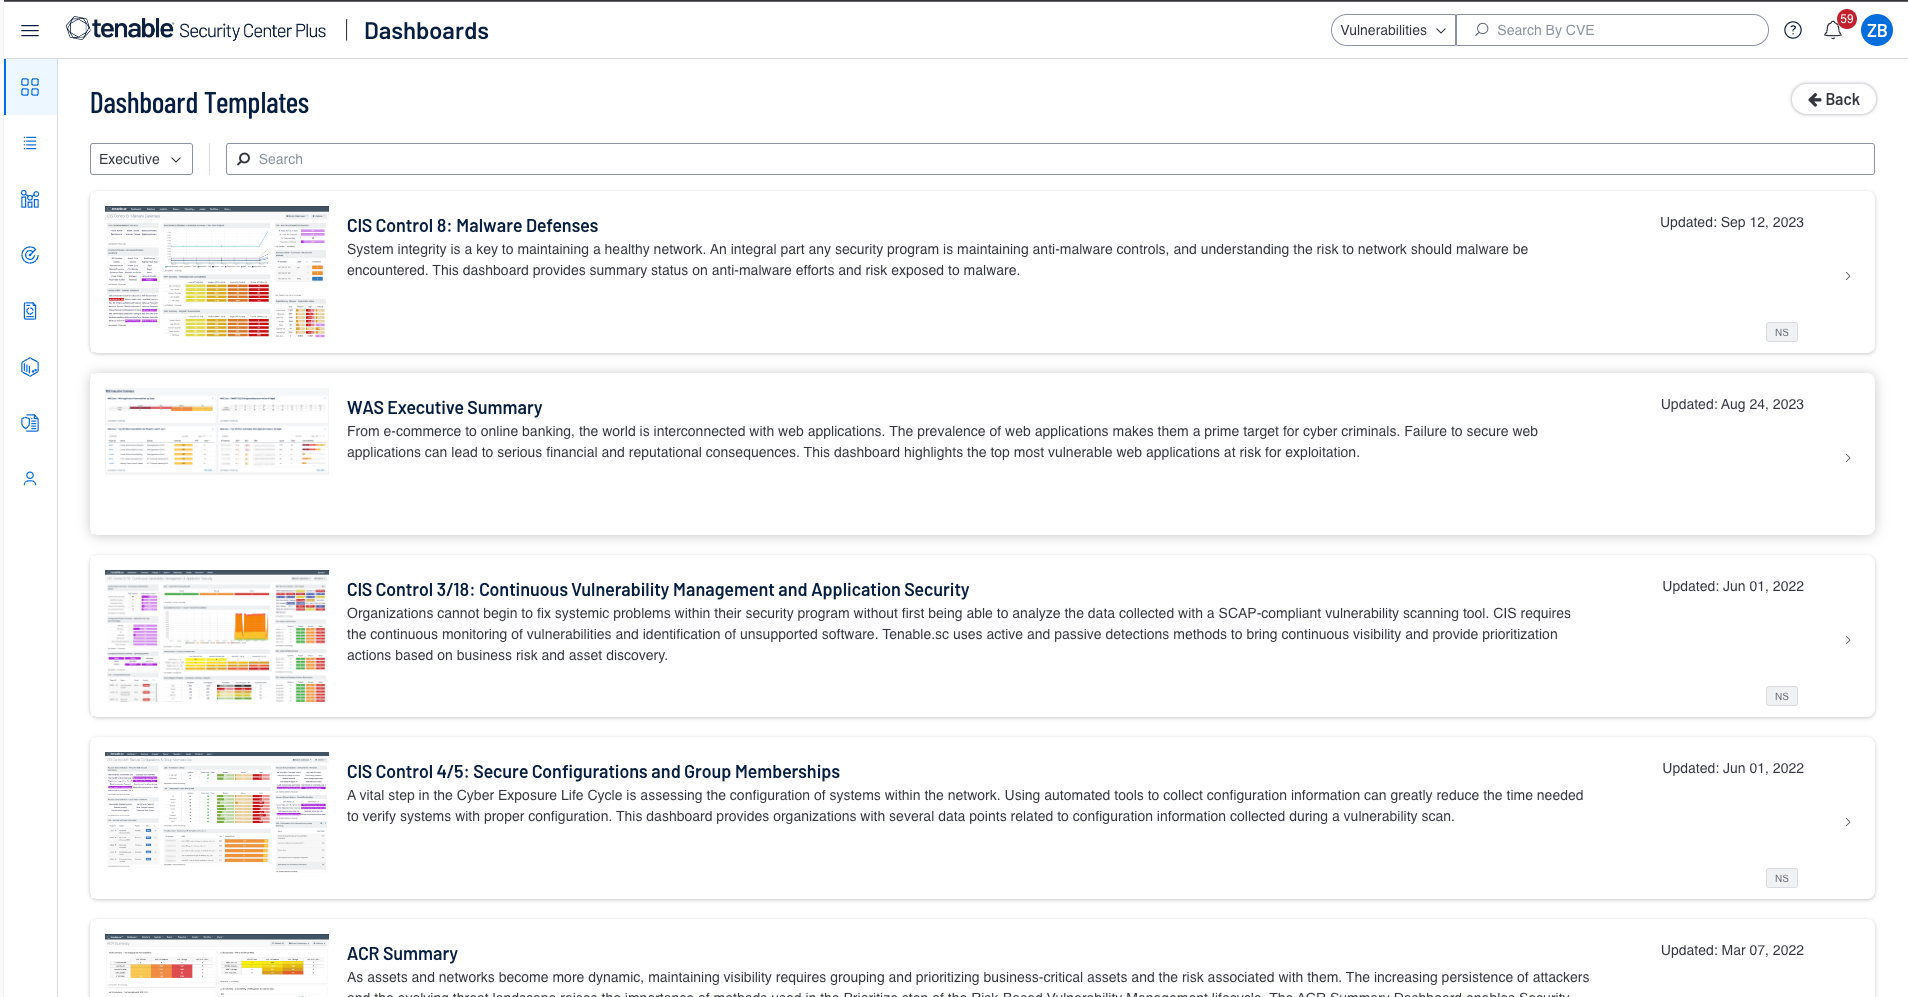
- Clear, actionable insight into data with highly customizable dashboards, reports and workflows
- Instantly identify and prioritize vulnerabilities using built-in risk scores and threat intelligence
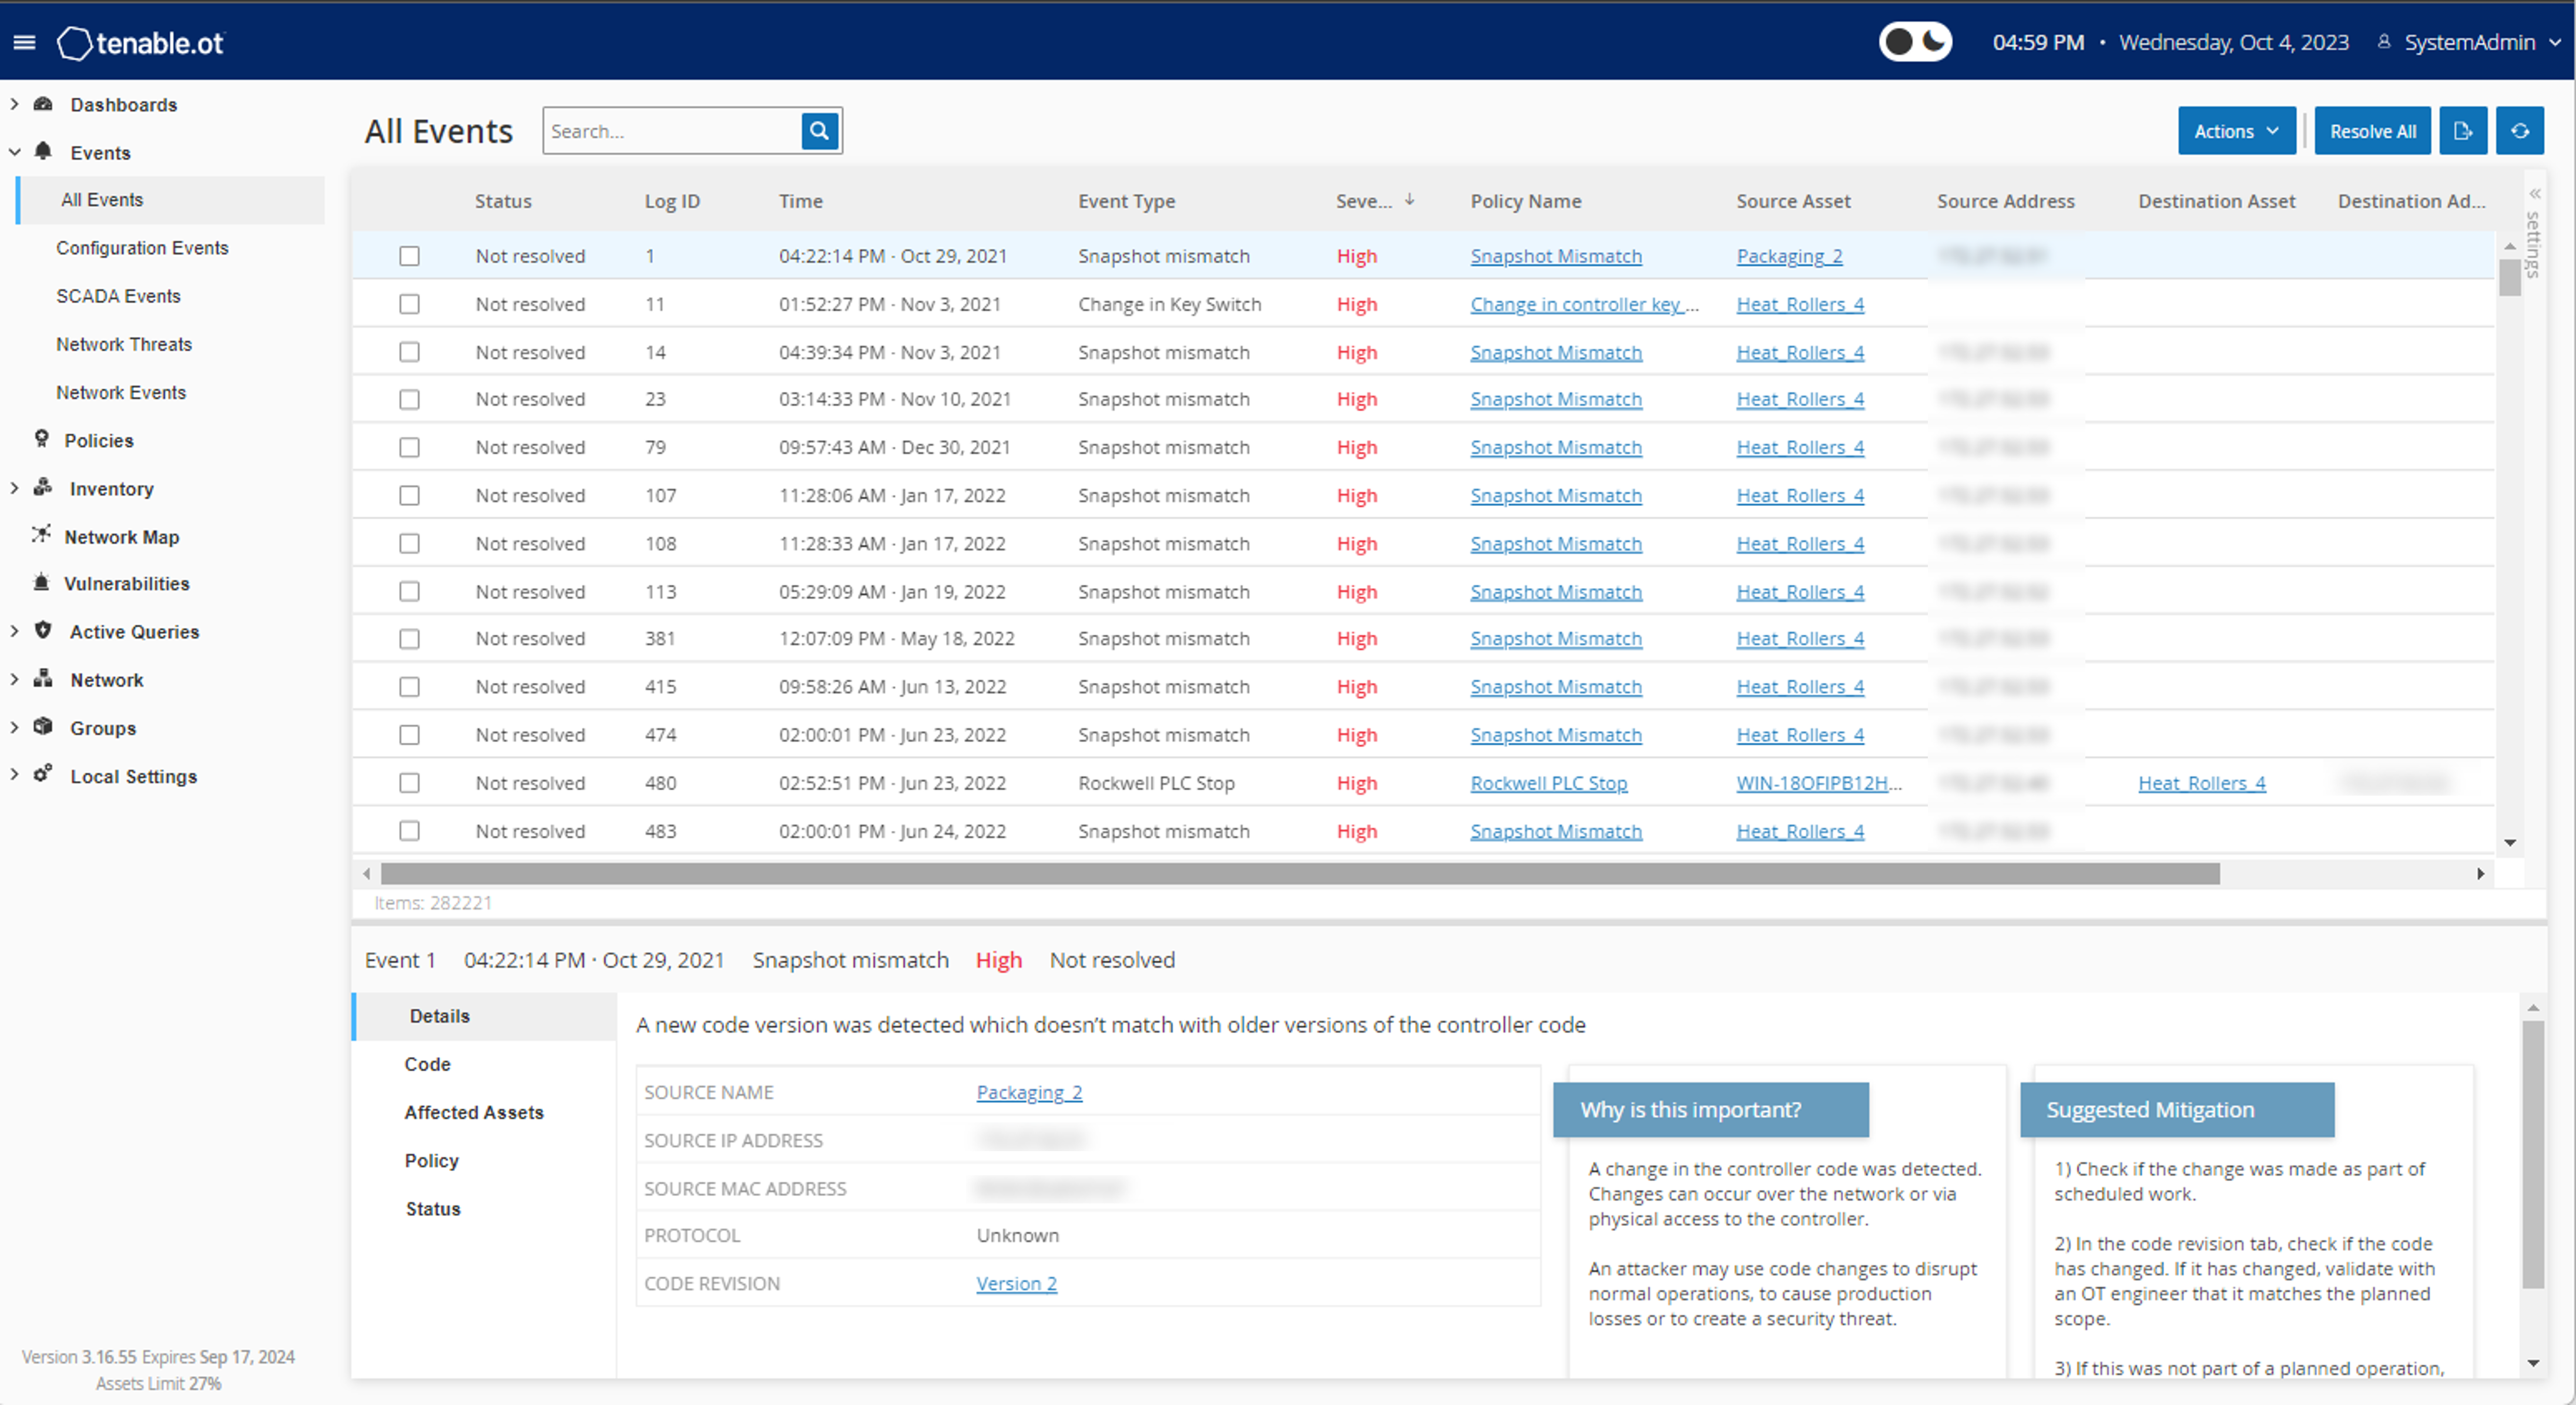
- Speed up incident response with customizable configuration alerts, notification and ticketing
- Free API access for customer integrations, data acquisition and data enrichment
- Discover unknown assets on your external attack surface
Tenable Security Center Plus
Includes all Tenable Security Center benefits as well as:
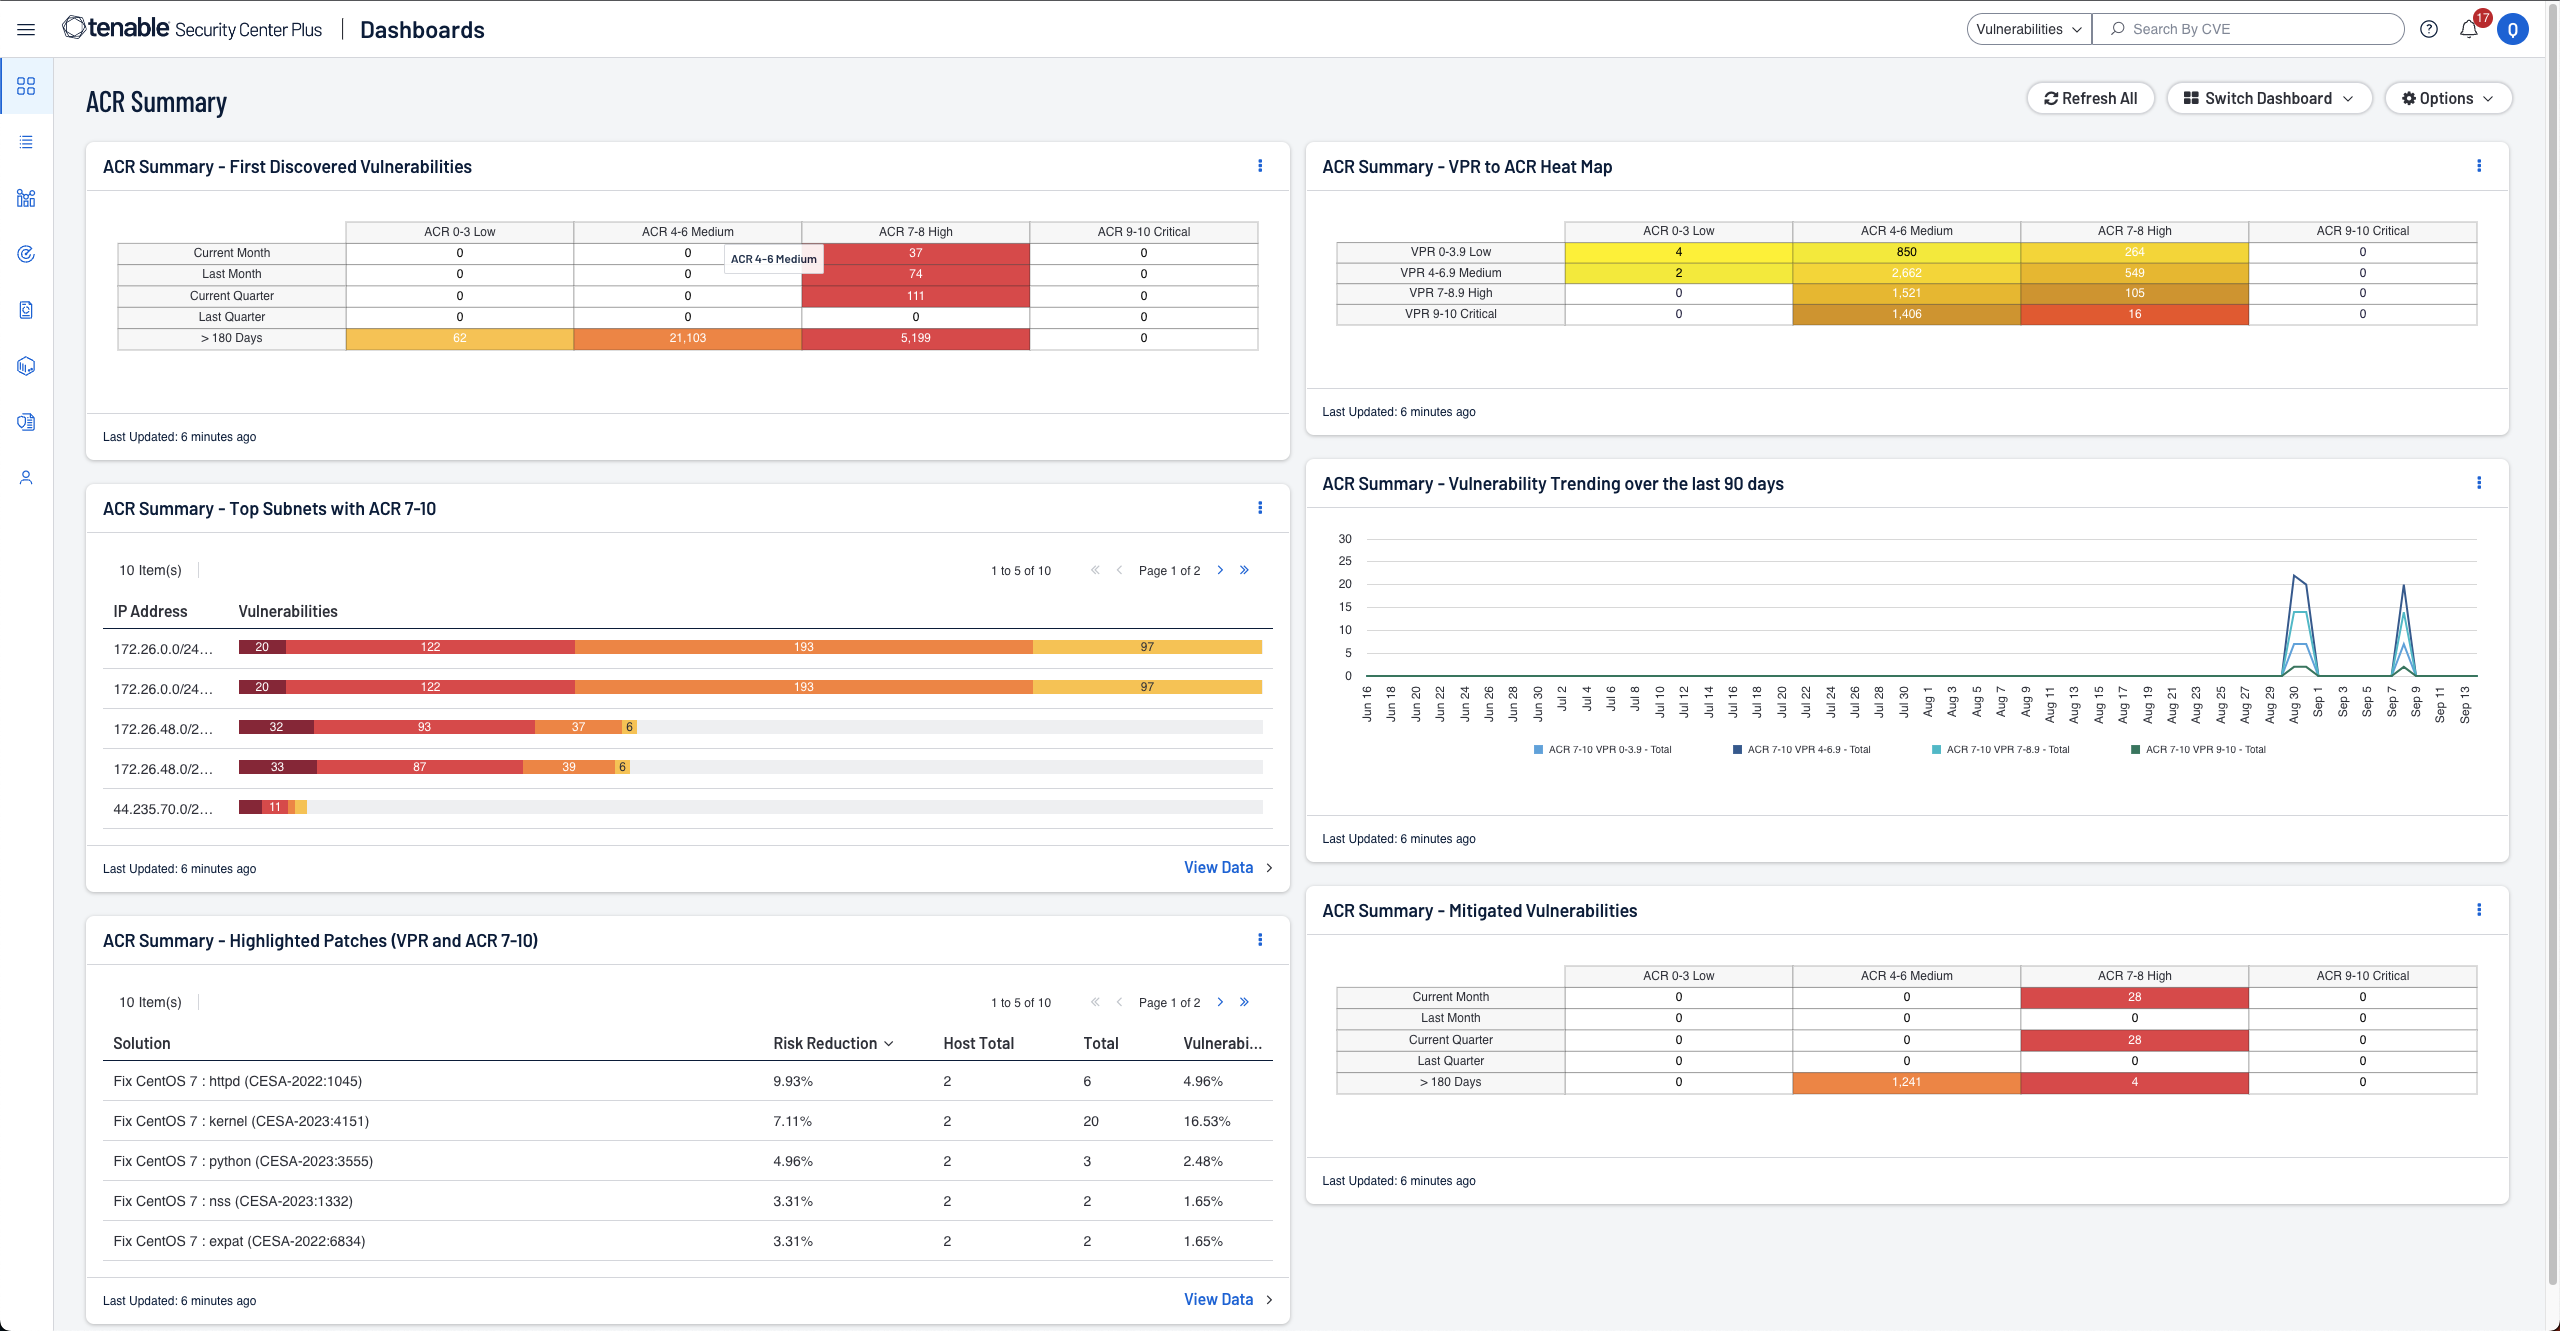
- Gain a deeper understanding and context of your assets using Asset Criticality Rating (ACR)
- Real-time asset and vulnerability discovery and continuous monitoring for the highest level of visibility
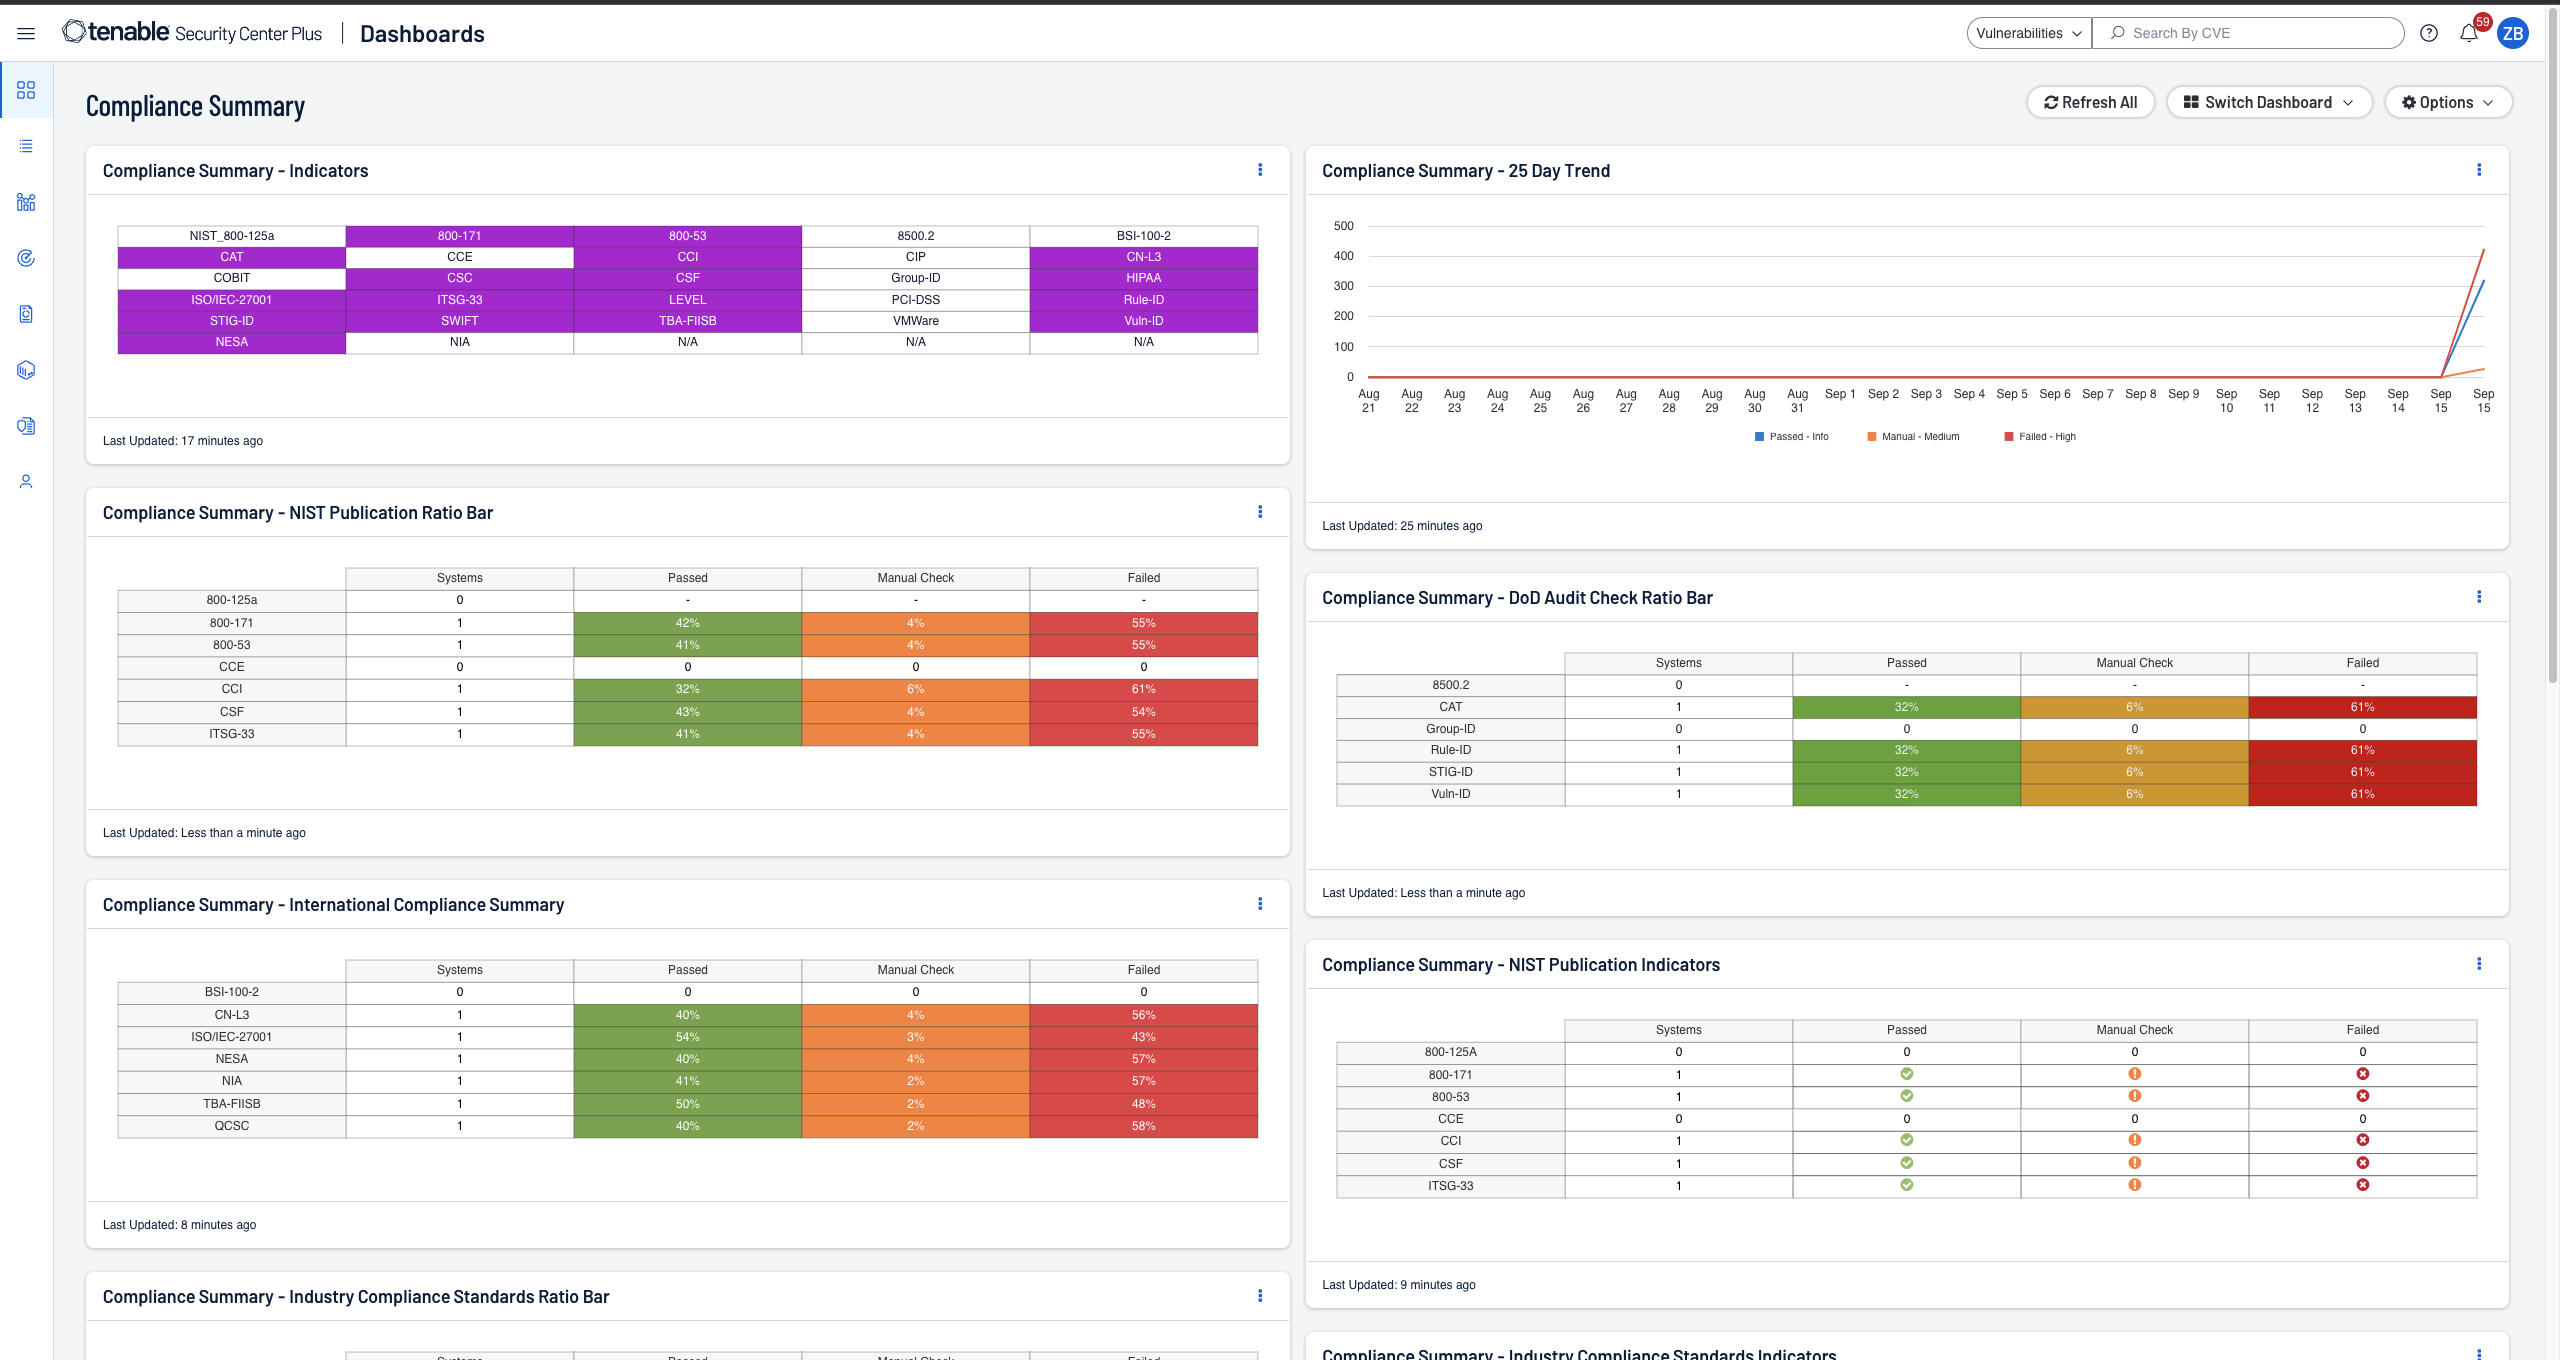
- Streamlined compliance reporting with real-time metrics and proactive alerts on violations
- Real-time detection of botnets and command and control traffic
- Identification of previously unknown resources, changes in behavior and new application usage
Tenable Security Center Director
For customers with multiple Tenable Security Center consoles, Tenable Security Center Director is available as an add-on to Tenable Security Center or Tenable Security Center Plus.
- Single pane of glass to view and manage your network across all Tenable Security Center consoles
- Easily manage scans for each Tenable Security Center console from one central location
- Centralized network management to facilitate reporting and management of multiple consoles, scanners and assets
- Centralized reporting across multiple Tenable Security Center consoles to easily measure your cyber risk
#1 in Vulnerability Management
Actively identify, investigate and prioritize vulnerabilities

reduction in vulnerabilities that need to be fixed first through Predictive Prioritization
"Tenable Security Center has become the voice of truth for our network, providing an additional layer of insight to hold ourselves accountable and to validate the success of our security program to our board of directors."Ted Tomita, Senior Vice President and Chief Technology Officer, Catskill Hudson Bank
Quickly Measure And Analyze Security And Compliance Risk

Ready to manage and reduce cyber risk across your entire organization?
Tenable Lumin is now available for Tenable Security Center.
Learn More About Tenable Lumin

